
Weekly Market Insights
Last week’s holiday-shortened trading was full of disappointing economic data, and risk assets such as stocks and commodities, traded with a heavier tone. The S&P 500 was down
-4.25% when the final bell rang, while the NASDAQ shed more than -5.5% of its value, led by a massive double-digit selloff in the semiconductor space. 9 of the 11 sectors were in the red with only real estate and consumer staples posting a gain for the week.
A soft Chinese manufacturing report, weak European PMI data, and a disappointing U.S. ISM manufacturing release set the tone on Tuesday. A weaker than anticipated Job Openings and Labor Turnover (JOLTS) report and comments from Dollar Tree CFO regarding weak consumer spending trends on Wednesday kept investor sentiment low, but the real blow came out Thursday morning when the ADP Employment Change report showed only 99k new workers, about 1/3 less than expected! If this wasn’t enough, the ISM Services report showed a weak employment index and rising prices. while the big event of the weak, Friday’s August Employment Report, disappointed with weaker-than-expected job growth and higher-than-expected wage inflation.
Treasury bonds rallied with the 10-year yield dropping -20bps (.20%) for the week and closing at its lowest level since July of 2023. The 10’s-2’s yield curve (the difference between the 10-year treasury rate and the 2-year treasury rate) un-inverted, as shorter-term rates fell faster than their longer-term counterpart as the entire yield curve sank. Commodities sold off hard on the growth concerns, with oil down close to -6.5% and industrial metals off by nearly 5%. Gold was the commodities star last week, only giving up roughly -.30% for the week. The US dollar, normally a safe haven in times of volatility, also shed a few basis points, as softer than expected foreign data provided a backstop despite the 2% rise in the Yen.
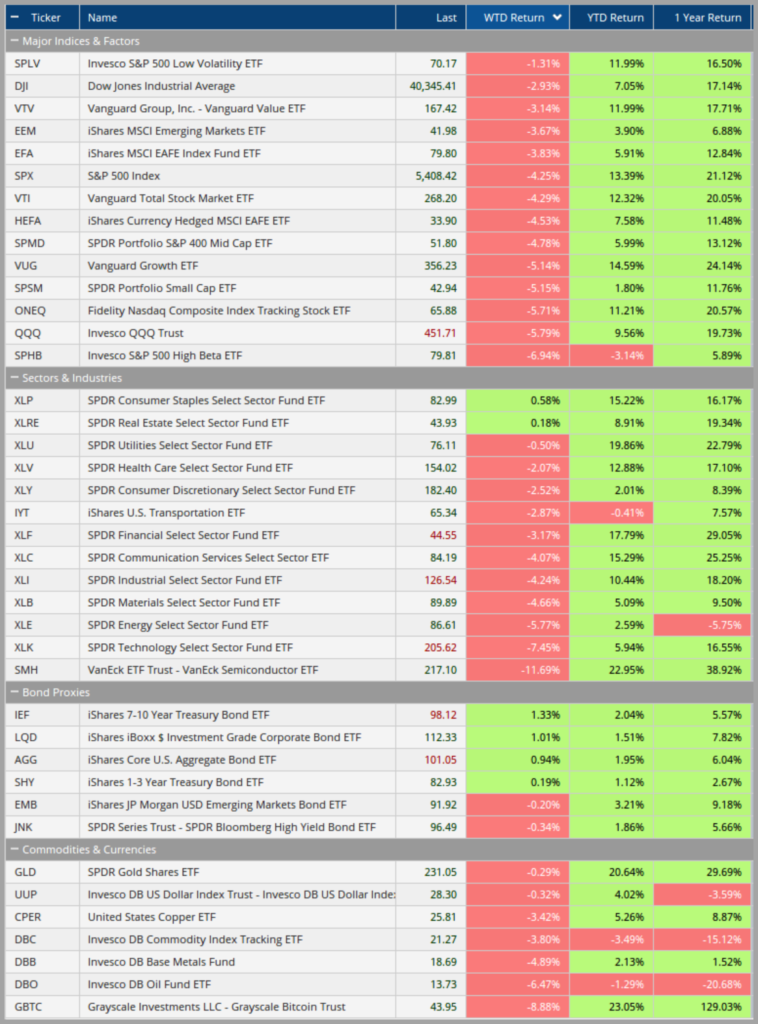
Source: DTN IQ
Key Takeaway:
September has a reputation on Wall Street for being volatile and this year is looking to validate that thesis with a few weak economic datapoints. While last week’s data is certainly concerning, it’s important to recognize that is does not constitute a trend at this point and the underlying backdrop (solid GDP growth, historically low unemployment, moderating inflation and a Federal Reserve Board signaling lower rates to come) is still favorable.
The recently mentioned repositioning into defensive sectors and lower volatility has taken hold. Looking at the first graphic above, one can see the defensive sectors leading last week while SPLV (Low Volatility ETF) was at the top of the leader bord, while SPHB (Invesco S&P 500 High Beta ETF) was at the bottom. This defensive rotation in equities, coupled with a decline in the commodity space and strength in bonds, is clearly signaling a risk off tone with respect to intermarket dynamics. Whether or not this is just a mild growth scare or something more lasting heading our way, it deserves close attention with valuations at their current lofty levels.
The Week Ahead:
According to statistics derived from the options market, this week’s “Expected Move” (EM) for the S&P 500 is a massive +/- 158 points. Last week’s selloff blew through the expected range by over 100 pts, setting the tone for further volatility ahead as traders and investors reposition assets.
This week’s economic reports will be centered around inflation with CPI on Wednesday and the relatively lesser important PPI Thursday. Investors will be trying to gain further insight on whether the Fed will cut rates by .25% or .50% and these two reports provide some further clues.
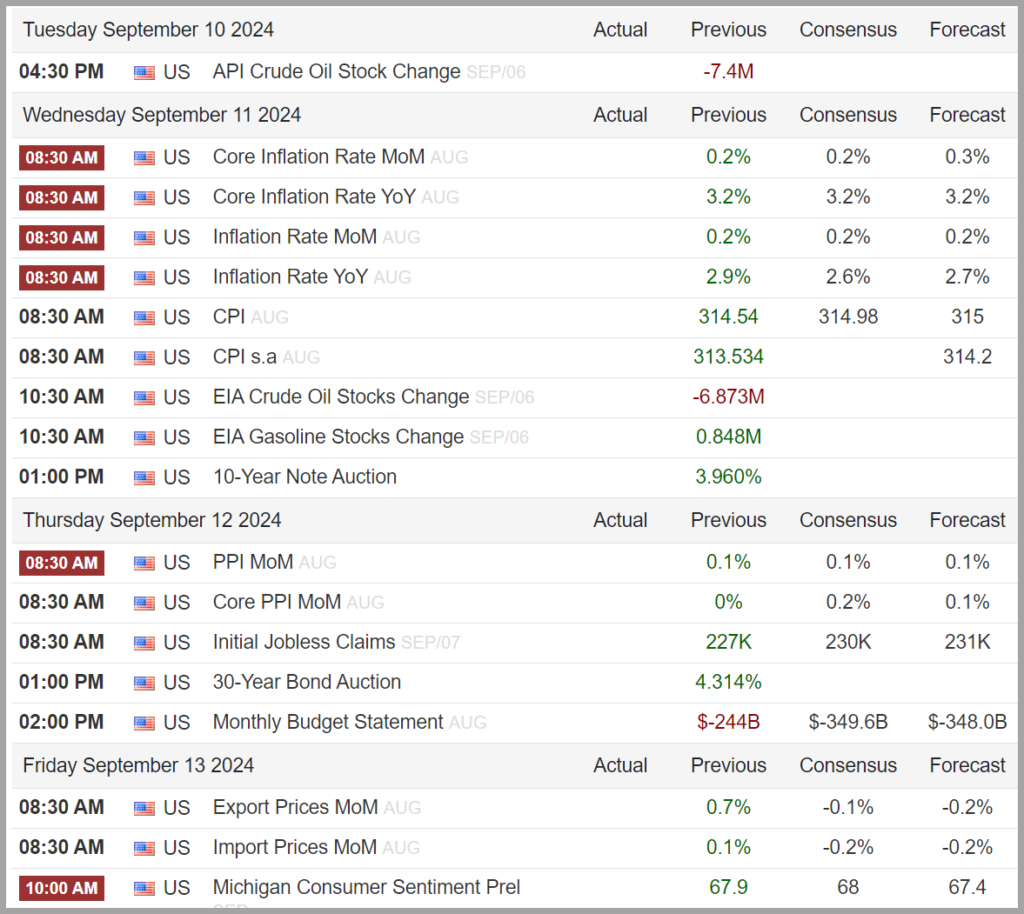
Source: Trading Economics (https://tradingeconomics.com/united-states/calendar#)
Tidbits & Technicals: (New developments will be denoted via***)
Current Headwinds:
- Valuations seem frothy given the current rate environment, leaving the markets subject to a potential swift pullback!
- “Higher for Longer” – Risk that the Federal Reserve waits too long to begin lowering rates and threatens economic growth.
- Very narrow market participation, apparently driven primarily by mega cap tech and AI-related companies, has dominated the indices; however, over the last several weeks we have witnessed a significant broadening effect with “the rest of the market” participating in returns.
Current Tailwinds:
- Optimism surrounding Artificial Intelligence (AI) (recently waning)
- The Federal Reserve signaled rate cuts are upon us.
- Strong Labor Market (signs of rising unemployment are showing up, yet jobs are available)
- Solid Economic Growth
- Continued Earnings Growth (the pace of which may be slowing)
- Momentum
- ***10-year Treasury yields continue to trade lower to new annual lows
Sentiment:
- Credit Spreads have returned to historically low levels following a recent spike due to the growth scare in August
- ***The VIX (CBOE Volatility Index) has moved significantly higher, typically signaling fear among investors
- ***The CNN FEAR & Greed Index has moved back to “FEAR” signaling waning investor optimism
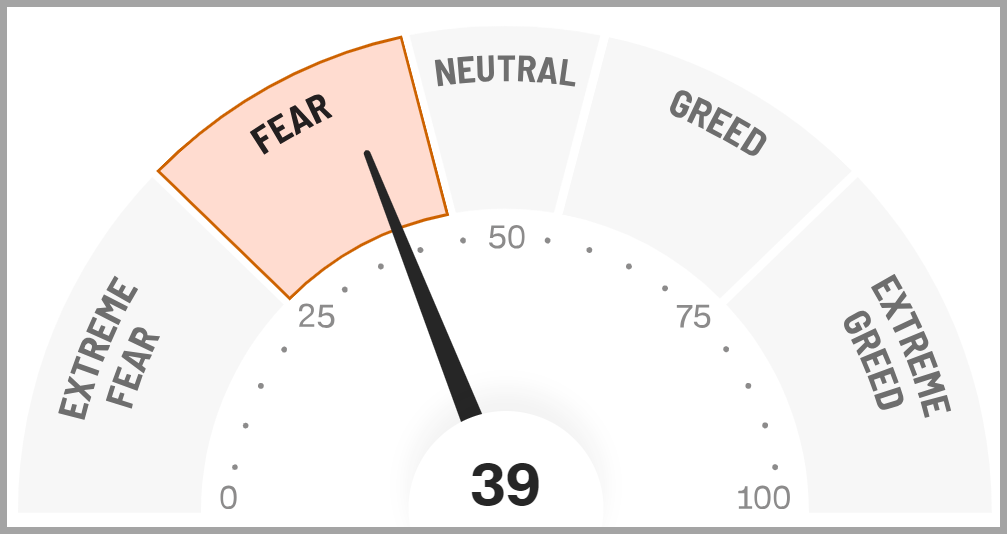
Source: https://www.cnn.com/markets/fear-and-greed
Intermarket Trends:
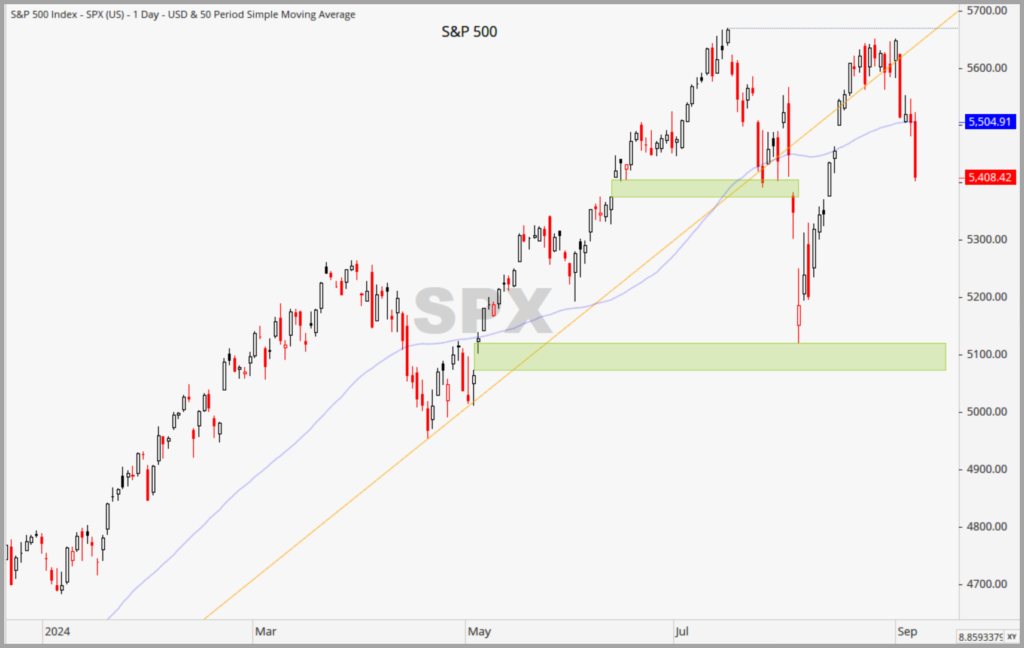
- ***The major Indices (Dow Jones Industrial Average, S&P 500, and NASDAQ) are trading at or near all-time highs signifying a positive trend
- Interest rates have been volatile all year and appear to be trending lower.
- The US Dollar has broken its upward trend line over the past several weeks and is beginning to trend downward
- Gold recently broke out of its trading range to record highs
- Industrial Metals, which have been trending lower lately, have reversed course and have been gaining traction
- Oil futures are in the middle of their one-year trading band and appear to be stuck in a trading range
Tying it all together:
Despite the recent rally, we maintain a cautious outlook on the market as some of the recent factors which caused the pullback don’t just disappear overnight. The Bank of Japan’s divergent monetary policy and the ongoing slowdown in the U.S. economy pose some significant risks to markets going forward. Also of note, at the present time, it appears investors may be potentially factoring in a more aggressive interest rate easing cycle than the Fed might deliver, while several historically relevant “warning signals” have been fired off recently, namely the Sahm Rule (where 3-month average unemployment rises by more than 0.5% above is annual low) and the 10s-2s yield curve un-inverting. These realities, coupled with late-stage business cycle dynamics, have historically created a more challenging environment for stocks in the intermediate-term.
In the long term, economic growth is the primary driver and, while growth currently remains robust, we are now seeing signs of moderation. This does not mean everything is falling apart; in fact, this was arguably the Federal Reserve Board’s intention. They have held interest rates high for a long time to combat inflation and the expected result of such policies is economic moderation and a cooling of the labor market. The Fed is shooting for a soft landing, a scenario whereby inflation returns towards their 2% target without destroying economic growth, and so far, that scenario appears most likely.
I’m keeping this paragraph below from my prior reports, as it really sums up expectations and what is currently taking place:
“Four main factors have seemingly been supporting the markets — strong growth, falling inflation, expectations of Fed rate cuts, and AI enthusiasm. These drivers remain intact; however, some key economic data points, like rising unemployment, are flashing warning signals at the present time. While the economy is not weak, some of the data suggests a weakening trend and this is a concern given the equity markets are not acknowledging the possibility of any sort of economic contraction. Current valuations have certain equities priced for perfection, so it would be fair to say that any type of growth scare could result in rather extreme volatility in the short run.”
I want to reiterate that the best approach in these environments is to ensure that one’s overall portfolio aligns with their risk tolerance and long-term goals and, add to this, the importance of keeping emotions at bay. Markets tend to overreact to both positive and negative data and keeping a calm perspective has always proven prudent.
Tactically, we recommend maintaining long-term investment exposure to equities focusing on lower volatility sectors and value factors at the present time. We also encourage a fair amount of duration and high quality, investment grade bonds in an effort to mitigate portfolio risk.
Please feel free to share these commentaries with friends and family and, should you have any questions regarding your current strategy or the markets in general, please reach out to your CIAS Investment Adviser Representative.
Important Disclosures:
Past performance is not indicative of future results. This material is not financial advice or an offer to sell any product. The statements contained herein are solely based upon the opinions of Edward J. Sabo and the data available at the time of publication of this report, and there is no assurance that any predicted or implied results will actually occur. Information was obtained from third-party sources, which are believed to be reliable, but are not guaranteed as to their accuracy or completeness.
The actual characteristics with respect to any particular client account will vary based on a number of factors including but not limited to: (i) the size of the account; (ii) investment restrictions applicable to the account, if any; and (iii) market exigencies at the time of investment. Capital Investment Advisory Services, LLC (CIAS) reserves the right to modify its current investment strategies and techniques based on changing market dynamics or client needs. The information provided in this report should not be considered a recommendation to purchase or sell any particular security. There is no assurance that any securities discussed herein will remain in an account’s portfolio at the time you receive this report or that securities sold have not been repurchased. The securities discussed may not represent an account’s entire portfolio and in the aggregate may represent only a small percentage of an account’s portfolio holdings. It should not be assumed that any of the securities transactions, holdings or sectors discussed were or will prove to be profitable, or that the investment recommendations or decisions we make in the future will be profitable or will equal the investment performance of the securities discussed herein.
CIAS is a registered investment advisor. More information about the advisor, including its investment strategies and objectives, can be obtained by visiting www.capital-invest.com. A copy of CIAS’s disclosure statement (Part 2 of Form ADV) is available, without charge, upon request. Our Form ADV contains information regarding our Firm’s business practices and the backgrounds of our key personnel. Please contact us at (919) 831-2370 if you would like to receive this information.
Capital Investment Advisory Services, LLC
100 E. Six Forks Road, Ste. 200; Raleigh, North Carolina 27609
Securities offered through Capital Investment Group, Inc. & Capital Investment Brokerage, Inc.
100 East Six Forks Road; Raleigh, North Carolina 27609
Members FINRA and SIPC