
Weekly Market Insights
Stocks experienced a relief rally last week as tensions in the Middle East eased and better-than-expected earnings from some of the corporate giants mitigated concerns despite what was a mostly negative week of economic data. The S&P 500 climbed over 2.5% for the week, bringing this year’s total increase to just under 7%.
Markets began stabilizing on Monday as fears over escalating conflicts between Israel and Iran subsided and what appeared to be a short covering rally from technical levels ensued. Tuesday saw a further boost with positive earnings reports from a few of the core cyclical names, but the momentum slowed on Wednesday. Thursday wasn’t pretty due to disappointing tech earnings and a troubling GDP report that when coupled with hot inflationary data from the core prices index , hinted of stagflation. Friday’s Core PCE data coupled with strong earnings from a couple of tech giants seemingly calmed investors nerves and gave the markets a boost heading into the weekend.
Key Takeaway:
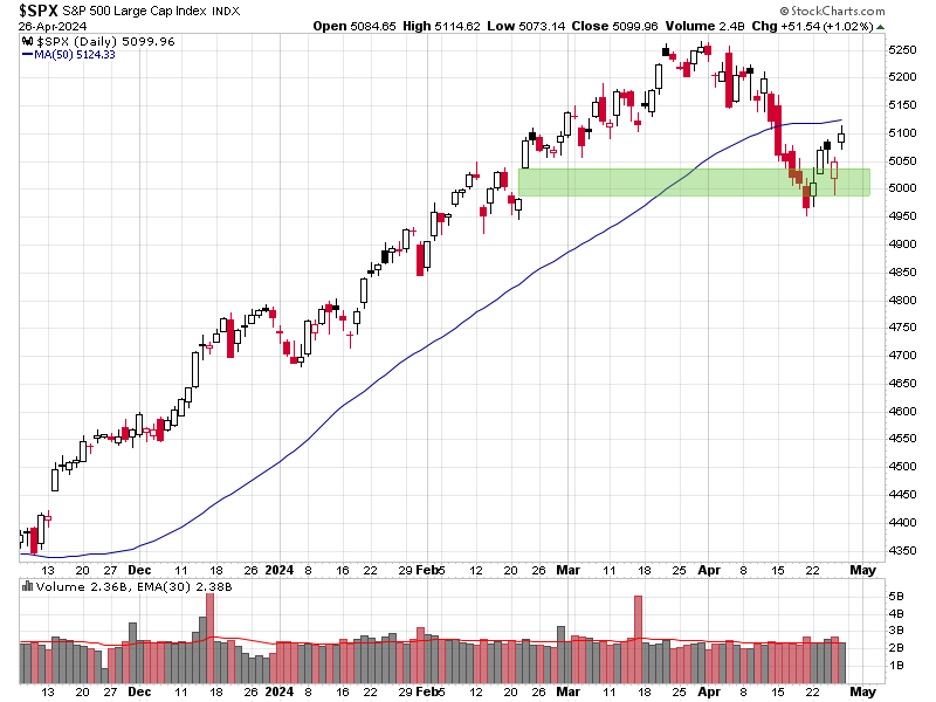
Last week’s economic data was not pretty. Thursday morning felt like one of those, “Oh Crap” moments where I had to remind myself that one poor set of information does not define a trend or change the overall environment. Slowing growth and sticky inflation are the market’s worst fears and I was quite surprised to see the rebound Thursday afternoon and Friday with a relatively extensive move up, given that Core PCE was not exactly a positive read either. With that being said, the recent 5% pullback we’ve witnessed seems justified and it’s always nice to see technical levels respected as that implies an orderly flow is still intact. The round number of 5,000 for the S&P, together with the large gap dating back to Nvidia’s earning spark back in April (green shaded area on the chart above) are, for now, the critical technical support levels we will be keeping an eye on and would like to see the recent lows hold.
The Week Ahead:
The pivotal event this week is Wednesday’s FOMC decision and without updated dots in this meeting, any clues regarding a potential rate cut in July will emerge from the FOMC statement or Powell’s press conference. The Board releases “dot plots” showing what each member expects future rate policy to be. They did not do that at this meeting. Factors favoring a July rate cut will help market sentiment, while indications against it will likely drive yields up and impact stocks down.
Economic data focus this week centers on the three key reports: the Jobs report, ISM Manufacturing PMI, and ISM Services PMI. A drop below 50 in the PMIs could signal an economic downturn and when combined with last week’s soft data, would not look nice. Friday’s jobs report will also be closely watched as everyone is now on a heightened alert coming out of last week’s surprisingly soft data.
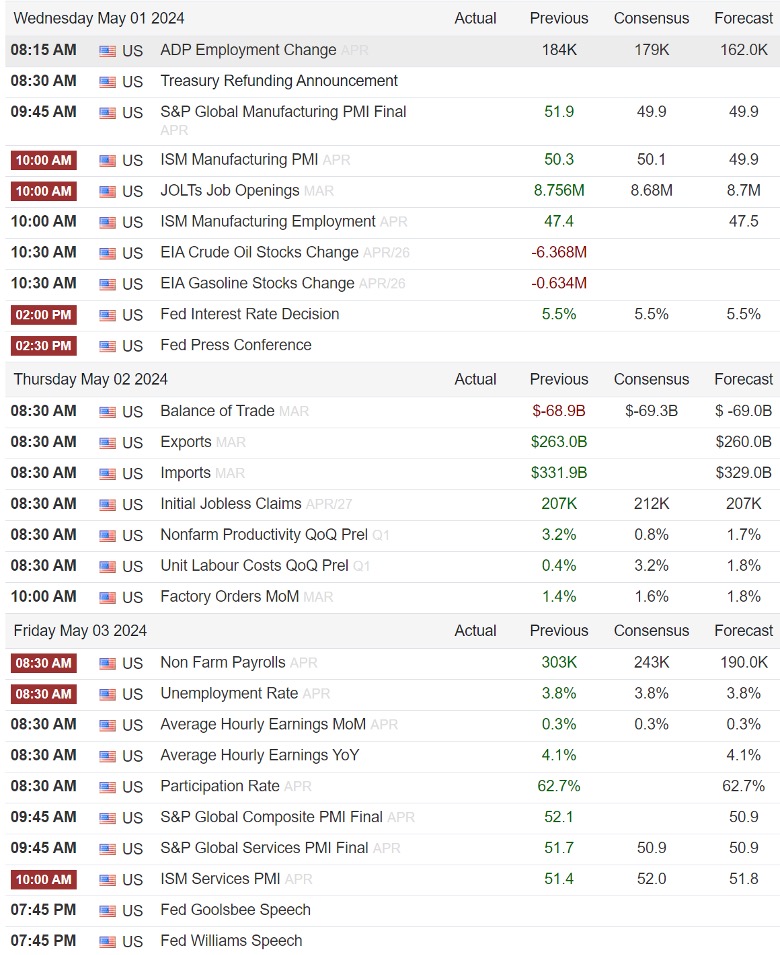
Source: Trading Economics (https://tradingeconomics.com/united-states/calendar#)
Tidbits & Technicals: (New developments will be denoted via***)
Current Headwinds:
- Valuations seem frothy given the current rate environment, leaving the markets subject to a potential swift pullback.
- “Higher for Longer” – Risk that the Federal Reserve waits too long to begin lowering rates and threatens economic growth.
- 10-year Treasury yields broke out to new highs for the year signaling that bond investors may be beginning to believe in the “Higher for Longer” thesis.
Current Tailwinds:
- Optimism surrounding Artificial Intelligence (AI)
- Federal Reserve pivoting from raising rates to potentially cutting in the future.
- Strong Labor Market
- Solid Economic Growth
- Continued Earnings Growth (the pace of which may be slowing)
- Momentum
- ***Participation is broadening with cyclicals taking a leadership role while the tech-trade begins to fade
Sentiment:
- Credit Spreads remain tight, signaling the bond market (aka “Smart Money”) is not worried about a recession in the near future.
- The VIX (CBOE Volatility Index) has broken through this years “complacency zone”.
- The CNN FEAR & Greed Index fell into the “FEAR” territory two weeks ago. “Buy when others are Fearful” should ring a bell.
Intermarket Trends:
- The major Indices (Dow Joines Industrial Average, S&P 500, and NASDAQ) all posted new highs in the past few weeks signifying a positive trend.
- Bond investors have been pricing in the idea of higher for longer recently with 10-year treasury yields above this year’s trading range to make new highs.
- The US Dollar is trading near the upper end of this year’s trading range due to foreign central banks being the first to cut rates and others taking further rate hikes off the table while the Fed continues its campaign of tough rhetoric.
- Gold continues to set record highs.
- Industrial Metals caught a bid recently and copper recently broke out of a multi-month trading range.
- Oil is trading near the top of its 2024 range but well below last year’s highs.
Tying it all together:
Following a 25% surge in the S&P 500 over the past several months, it should come as no surprise that recent market sentiment has shifted. Declines such as these are very common in the marketplace and tend to occur several times per year in a normal bull market cycle. Investors tend to push things too far when optimism prevails and momentum takes over, which may trigger a “cooling period” to allow the fundamentals to play catch up and investors a chance to reallocate funds from those areas of the market that may have gotten ahead of themselves (think AI and tech stocks) into the underappreciated.
This current volatility seems to stem from three main factors: a recalibration of expectations regarding Fed rate cuts, geopolitical tensions in the Middle East affecting oil and commodity prices, and a mixed outlook from companies during the S&P 500 first-quarter earnings season, despite beating forecasts. While these are important factors in determining valuations, they are (for now) considered short term in nature.
When assessing the current situation, one must also consider the underlying strength of the U.S. economy which is being supported by robust consumer demand and a healthy job market, along with signs of stabilization in global economic growth and the fact that inflation is trending downward. These are the variables that will shape future market dynamics and should play a far more important role in shaping one’s allocation decisions. Very recent data has been soft and warrants our attention, however, we must gather more clues and not attempt to make any rash predictions based off a few weak data points. We will follow all future developments closely and report our findings to you here.
Please feel free to share these commentaries with friends and family and, should you have any questions regarding your current strategy or the markets in general, please reach out to your CIAS Investment Adviser Representative.
Important Disclosures:
Past performance is not indicative of future results. This material is not financial advice or an offer to sell any product. The statements contained herein are solely based upon the opinions of Edward J. Sabo and the data available at the time of publication of this report, and there is no assurance that any predicted or implied results will actually occur. Information was obtained from third-party sources, which are believed to be reliable, but are not guaranteed as to their accuracy or completeness.
The actual characteristics with respect to any particular client account will vary based on a number of factors including but not limited to: (i) the size of the account; (ii) investment restrictions applicable to the account, if any; and (iii) market exigencies at the time of investment. Capital Investment Advisory Services, LLC (CIAS) reserves the right to modify its current investment strategies and techniques based on changing market dynamics or client needs. The information provided in this report should not be considered a recommendation to purchase or sell any particular security. There is no assurance that any securities discussed herein will remain in an account’s portfolio at the time you receive this report or that securities sold have not been repurchased. The securities discussed may not represent an account’s entire portfolio and in the aggregate may represent only a small percentage of an account’s portfolio holdings. It should not be assumed that any of the securities transactions, holdings or sectors discussed were or will prove to be profitable, or that the investment recommendations or decisions we make in the future will be profitable or will equal the investment performance of the securities discussed herein.
CIAS is a registered investment advisor. More information about the advisor, including its investment strategies and objectives, can be obtained by visiting www.capital-invest.com. A copy of CIAS’s disclosure statement (Part 2 of Form ADV) is available, without charge, upon request. Our Form ADV contains information regarding our Firm’s business practices and the backgrounds of our key personnel. Please contact us at (919) 831-2370 if you would like to receive this information.
Capital Investment Advisory Services, LLC
100 E. Six Forks Road, Ste. 200; Raleigh, North Carolina 27609
Securities offered through Capital Investment Group, Inc. & Capital Investment Brokerage, Inc.
100 East Six Forks Road; Raleigh, North Carolina 27609
Members FINRA and SIPC