Weekly Market Insights
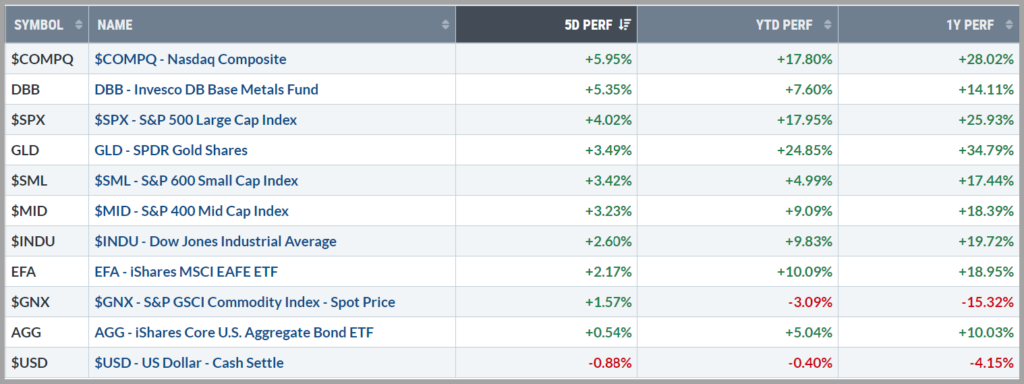
Rather “firm” CPI and PPI reports last week were largely offset by the “Fed Whisperer” and better-than-expected guidance from giants Oracle and Nvidia. The technology sector led the charge with 8+ % gains across the semiconductor complex. All but one sector, energy, was up last week and most were higher by more than 3%.
Despite firm inflation data, hopes for a 50-basis-point rate cut persisted. This was no doubt aided by Nick Timiraos’ Wall Street Journal article which carried a very dovish tone (larger rate cut implications). Treasury yields initially traded to new 52-week lows, but the 10-year yield mostly chopped sideways closing the week at 3.65%. The dollar ultimately closed the week 0.25% lower, sending commodities higher in general. Gold and copper both closed the week higher by more than 3%.

Source: StockCharts.com

Key Takeaway:
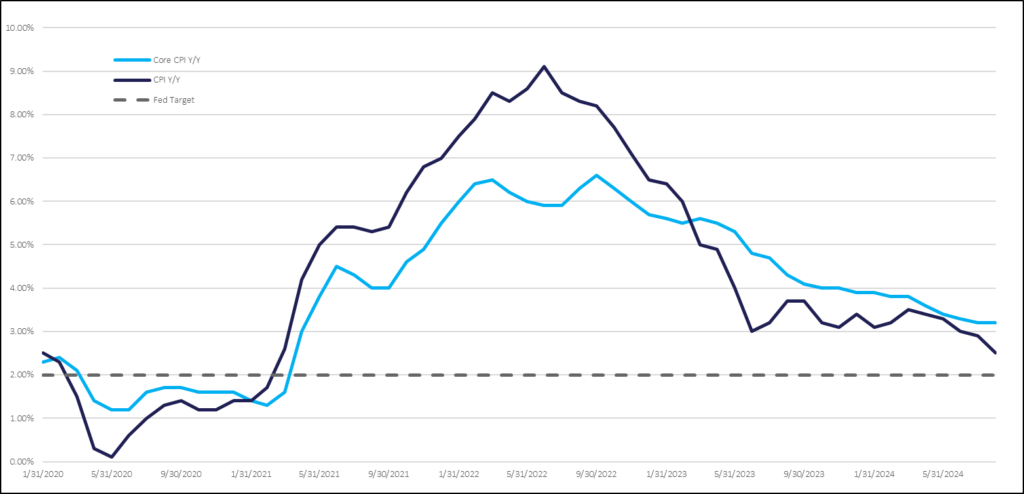
The main takeaway from last week’s data is that inflation isn’t rebounding, and the Fed remains on track to cut rates. However, the data suggested the Fed may cut less aggressively than anticipated, so rates may not fall as quickly in the future as markets had expected. This raises the possibility of the Fed falling behind the curve to support economic growth and that increases the risk of a harsher landing (economic slowdown).
Interestingly, the “Fed Whisperer”, Nick Timiraos of the Wall Street Journal (to whom many believe the Fed leaks data), released an article Thursday afternoon which tended to imply the Fed would front-load rate cuts by going with the more aggressive 50 basis points (0.50%) this week. The article appears to be an attempt to ease potential concerns that the Fed would be cutting more aggressively, not out of fear of the current situation, but rather to ensure they stay ahead of the curve. Since the writing of that article, the probability of a 50bps cut more than doubled as of Fridays trading session according to the CME FedWatch Tool.

The Week Ahead:
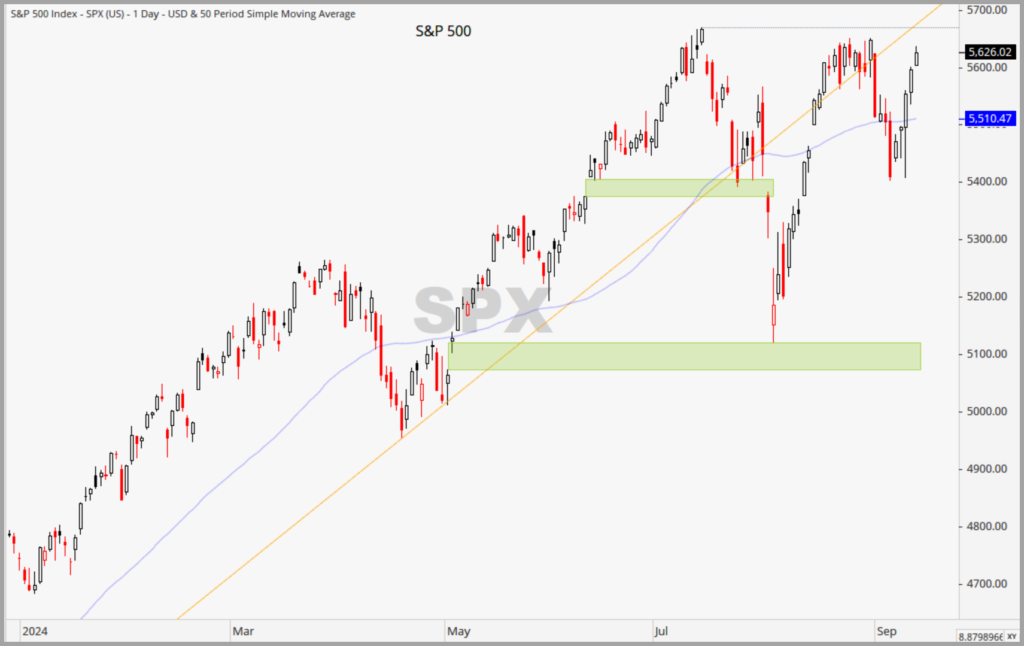
According to statistics derived from the options market, this week’s “Expected Move” (EM) for the S&P 500 is +/- 114 points, down from last week’s massive 158-point EM. Last week’s runup exceeded the expected range top by 60pts, demonstrating just how volatile the current environment remains and I would expect continued volatility surrounding the Fed’s rate decision.
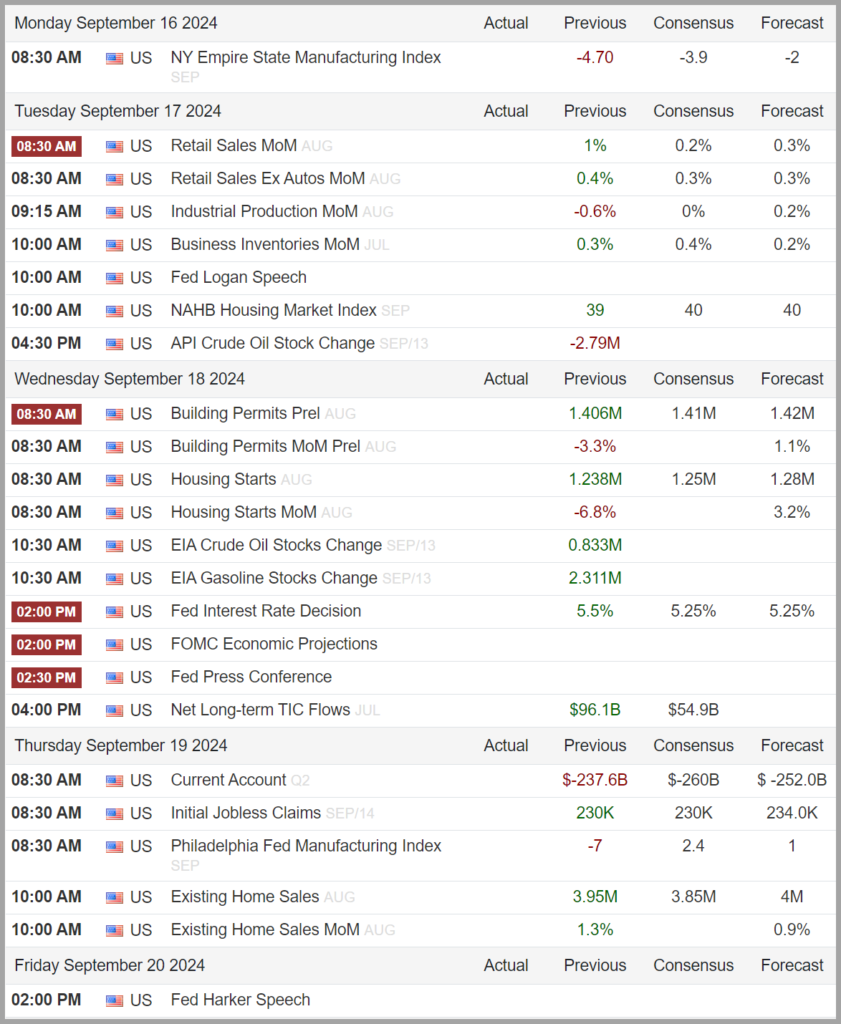
The main event this week is Wednesday’s FOMC decision, with the focus on whether the rate hike will be 25 or 50 basis points. Powell’s comments and tone regarding potential future cuts will also be critical, as the market has already priced in a 100-basis point (1%) reduction by year-end. This week also brings several key economic reports that will offer a deeper dive into the economy. Retail Sales, releasing tomorrow, have been flat for months, and a sudden decline could suggest consumers are pulling back, raising concerns the Fed may be behind the curve. Additionally, the Empire and Philly Fed manufacturing indices, out today and Thursday, will provide a first look at September’s economic activity.

Source: Trading Economics (https://tradingeconomics.com/united-states/calendar#)
Tidbits & Technicals: (New developments will be denoted via***)
Current Headwinds:
- Valuations seem frothy given the current rate environment, leaving the markets subject to a potential swift pullback!
- “Higher for Longer” – Risk that the Federal Reserve waits too long to begin lowering rates and threatens economic growth.
- Very narrow market participation, apparently driven primarily by mega cap tech and AI-related companies, has dominated the indices; however, over the last several weeks we have witnessed a significant broadening effect with “the rest of the market” participating in returns.
Current Tailwinds:
- Optimism surrounding Artificial Intelligence (AI) (recently waning)
- The Federal Reserve signaled rate cuts are upon us.
- Strong Labor Market (signs of rising unemployment are showing up, yet jobs are available)
- Solid Economic Growth
- Continued Earnings Growth (the pace of which may be slowing)
- Momentum
- ***10-year Treasury yields continue to trade lower to new annual lows
Sentiment:
- **Credit Spreads which recently returned to historically low levels following a spike, have strangely been widening a bit lately.
- ***The VIX (CBOE Volatility Index) has settled down somewhat but remains elevated when compared to this year’s lower trend.
- ***The CNN FEAR & Greed Index is back to Neutral

Source: https://www.cnn.com/markets/fear-and-greed
Intermarket Trends:
- ***The major Indices (Dow Jones Industrial Average, S&P 500, and NASDAQ) are trading at or near all-time highs signifying a positive trend
- Interest rates have been volatile all year and appear to be trending lower.
- The US Dollar has broken its upward trend line over the past several weeks and is beginning to trend downward
- Gold recently broke out of its trading range to record highs
- Industrial Metals, which have been trending lower lately, have reversed course and have been gaining traction
- Oil futures are in the middle of their one-year trading band and appear to be stuck in a trading range
Tying it all together:
The recent runup and subsequent failure to breakout to fresh all-time highs fits the technical pattern known as a “failed breakout.” Historically, this is not a positive signal for the market. When a failed breakout occurs, especially during periods when employment is showing signs of cooling, the yield curve is emerging from inversion after a prolonged period and credit spreads are widening, volatility tends to rear its ugly head for longer than most would like.
With that current technical picture aside, my confidence in this current bull market remains cautiously optimistic, as the overall trend is positive and the overall fundamental backdrop appears to support these levels. My conviction will strengthen if/when price action in the major indices reinforces the trend by breaking out to all-time highs. It’s important to recognize at this juncture that the recent rotation out of AI/technology-related stocks and into “other areas of the market’ increases the challenge for the indices to break out to new highs, since the technology sector represents a huge portion of several of the indices we use to track the markets (S&P 500, NASDAQ, etc.), therefore, it will take a stronger “push” by the other sectors to obtain this goal.
One can measure that “push” by looking under the hood of the market to gauge the broader participation, using measures of “market internals”. The most widely used measures of internal strength are things such as the Advance-Decline line and its corresponding AD Volume derivative. At the present time, the Advance Decline metrics are trending upward, which shows that more and more stocks are moving up and they are doing so with strong volume. compared to those that are taking a break or moving downward.
This broad participation is a healthy attribute and fits well within the context of the current fundamental backdrop where we have robust economic growth, historically low unemployment, and inflation trending down. During periods like this, we may expect companies tied to the more cyclical sectors (Industrials, Materials, Financials, etc.) perform well, as it would be based on recent earnings reports. Capital is also flowing into these areas as we see stocks in these categories generally rising; however, we continue to see stronger flows into the more defensive sectors (Utilities, Healthcare and Consumer Staples). This emerging outperformance of defensive sectors is a dynamic we’d expect to see during the later stages of the business cycle, when concerns over future growth begin to appear.
The current intermarket dynamics (defensive equities showing leadership, growth-oriented commodities such as oil and industrial metals taking a breather, high yield credit spreads beginning to creep up, bonds moving up, etc.). coupled with current economic indicators showing a loss of momentum (inflation down but sticky here, unemployment ticking up, job openings declining, consumer trends weakening, etc.), warrant our close attention and monitoring with valuations for stocks being priced for perfection, as the Federal Reserve attempts to pull off the historically difficult soft landing — a scenario where they bring inflation down to their target level without cutting off economic growth and employment.
Our approach integrates macroeconomic data with technical and intermarket analysis, along with investor sentiment, to create an ongoing feedback loop which shapes our current tactical strategy. At the present time, we generally recommend maintaining long-term investment exposure to equities with a focus on quality factors and low volatility. We also encourage a fair amount of duration and high quality, investment grade bonds as we feel these can help mitigate overall portfolio risk while providing attractive returns.
Lastly, I want to emphasize that the most effective strategy in all market environments is to ensure one’s overall portfolio aligns with their risk tolerance and long-term goals while keeping emotions at bay. The markets often overreact to both positive and negative news, so having a sound plan, a cool head, and an understanding of the current sentiment is crucial. Staying disciplined and focused on your long-term objectives, rather than being swayed by short-term volatility, will help navigate uncertainty and capitalize on opportunities as they arise.
Please feel free to share these commentaries with friends and family and, should you have any questions regarding your current strategy or the markets in general, please reach out to your CIAS Investment Adviser Representative.
Important Disclosures:
Past performance is not indicative of future results. This material is not financial advice or an offer to sell any product. The statements contained herein are solely based upon the opinions of Edward J. Sabo and the data available at the time of publication of this report, and there is no assurance that any predicted or implied results will actually occur. Information was obtained from third-party sources, which are believed to be reliable, but are not guaranteed as to their accuracy or completeness.
The actual characteristics with respect to any particular client account will vary based on a number of factors including but not limited to: (i) the size of the account; (ii) investment restrictions applicable to the account, if any; and (iii) market exigencies at the time of investment. Capital Investment Advisory Services, LLC (CIAS) reserves the right to modify its current investment strategies and techniques based on changing market dynamics or client needs. The information provided in this report should not be considered a recommendation to purchase or sell any particular security. There is no assurance that any securities discussed herein will remain in an account’s portfolio at the time you receive this report or that securities sold have not been repurchased. The securities discussed may not represent an account’s entire portfolio and in the aggregate may represent only a small percentage of an account’s portfolio holdings. It should not be assumed that any of the securities transactions, holdings or sectors discussed were or will prove to be profitable, or that the investment recommendations or decisions we make in the future will be profitable or will equal the investment performance of the securities discussed herein.
CIAS is a registered investment advisor. More information about the advisor, including its investment strategies and objectives, can be obtained by visiting www.capital-invest.com. A copy of CIAS’s disclosure statement (Part 2 of Form ADV) is available, without charge, upon request. Our Form ADV contains information regarding our Firm’s business practices and the backgrounds of our key personnel. Please contact us at (919) 831-2370 if you would like to receive this information.
Capital Investment Advisory Services, LLC
100 E. Six Forks Road, Ste. 200; Raleigh, North Carolina 27609
Securities offered through Capital Investment Group, Inc. & Capital Investment Brokerage, Inc.
100 East Six Forks Road; Raleigh, North Carolina 27609
Members FINRA and SIPC

