
Weekly Market Insights
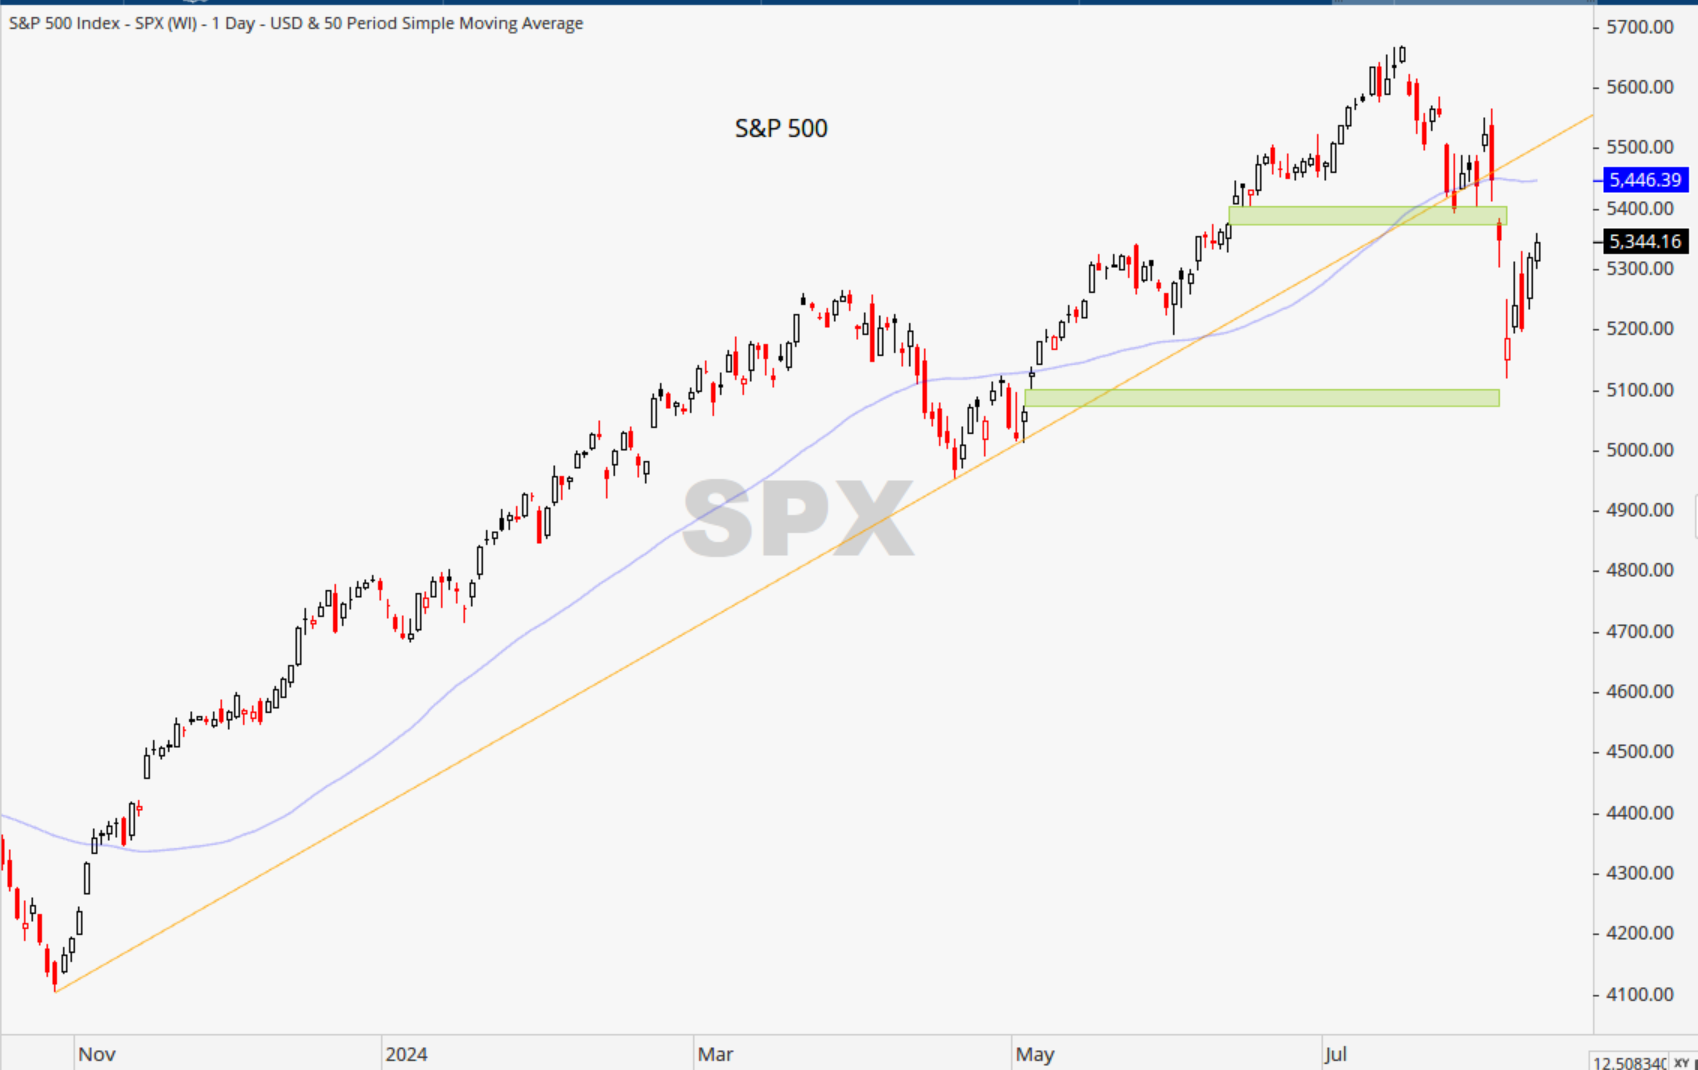
Last week marked the most significant spike in volatility we’ve seen in a long time as investors faced a trifecta of potential challenges: concerns over economic growth, the unwinding of the yen carry trade, and the rotation out of technology stocks. Despite the turbulence, the S&P 500 ended the week essentially unchanged thanks to the Bank of Japan reassuring investors they would not raise rates further in this volatile time (which calmed the carry trade fears), a solid ISM Services Index report that put us back in the economic expansion camp, and other important economic releases, namely Thursdays unemployment report which came in softer than expectations.
As could be expected, it was a wild ride in the bond market as interest rates initially fell to their lowest levels of the year. The 10-year treasury yield briefly traded down to 3.6% to start the week and the dollar followed suit along with most commodities. But just like equities, the risk-off tone changed almost immediately and each of these markets ended the week right back where they left off the prior Friday.
Source: www.stockcharts.com
Key Takeaway:
The past couple of weeks have been marked by volatility, yet trading has remained orderly, with no signs of liquidity issues—a reassuring sign. It’s also encouraging that markets responded positively to economic data, rather than ignoring it as they might have if sentiment had turned completely negative.
The Yen Carry Trade, which we discussed last week, has significant implications for global markets. When combined with other factors, it has the potential to create substantial market movements. The carry trade, along with recent economic data suggesting a moderation in the strong trends of the past year, certainly deserves our attention. In light of these developments, the Sahm Rule Recession Indicator recently flashed a warning signal, which is noteworthy given its perfect track record in predicting future recessions. Additionally, we’ve witnessed the longest inverted yield curve in history—where short-term interest rates exceed long-term rates—which has also been a precursor to past recessions. Over the past few weeks, high-yield spreads have risen by nearly 25%, reflecting the increased risk premium demanded by investors for holding debt from lower-credit-quality companies. Rapidly rising credit spreads have also been a sign of potential trouble ahead as sophisticated bond investors begin positioning their wealth away from companies with poorer credit quality leads one to believe they are fearing those firms’ ability to repay their debts in the future.
While these risks should not be dismissed, I don’t believe they signal the end of the bull market. There are still many positives at play, including economic growth, strong corporate profits, historically low unemployment, and declining inflation. Now is an opportune time to review portfolios and ensure they align with our risk tolerance. If certain sectors or asset classes have become disproportionately weighted, it may be wise to rebalance to a more appropriate mix.
The Week Ahead:
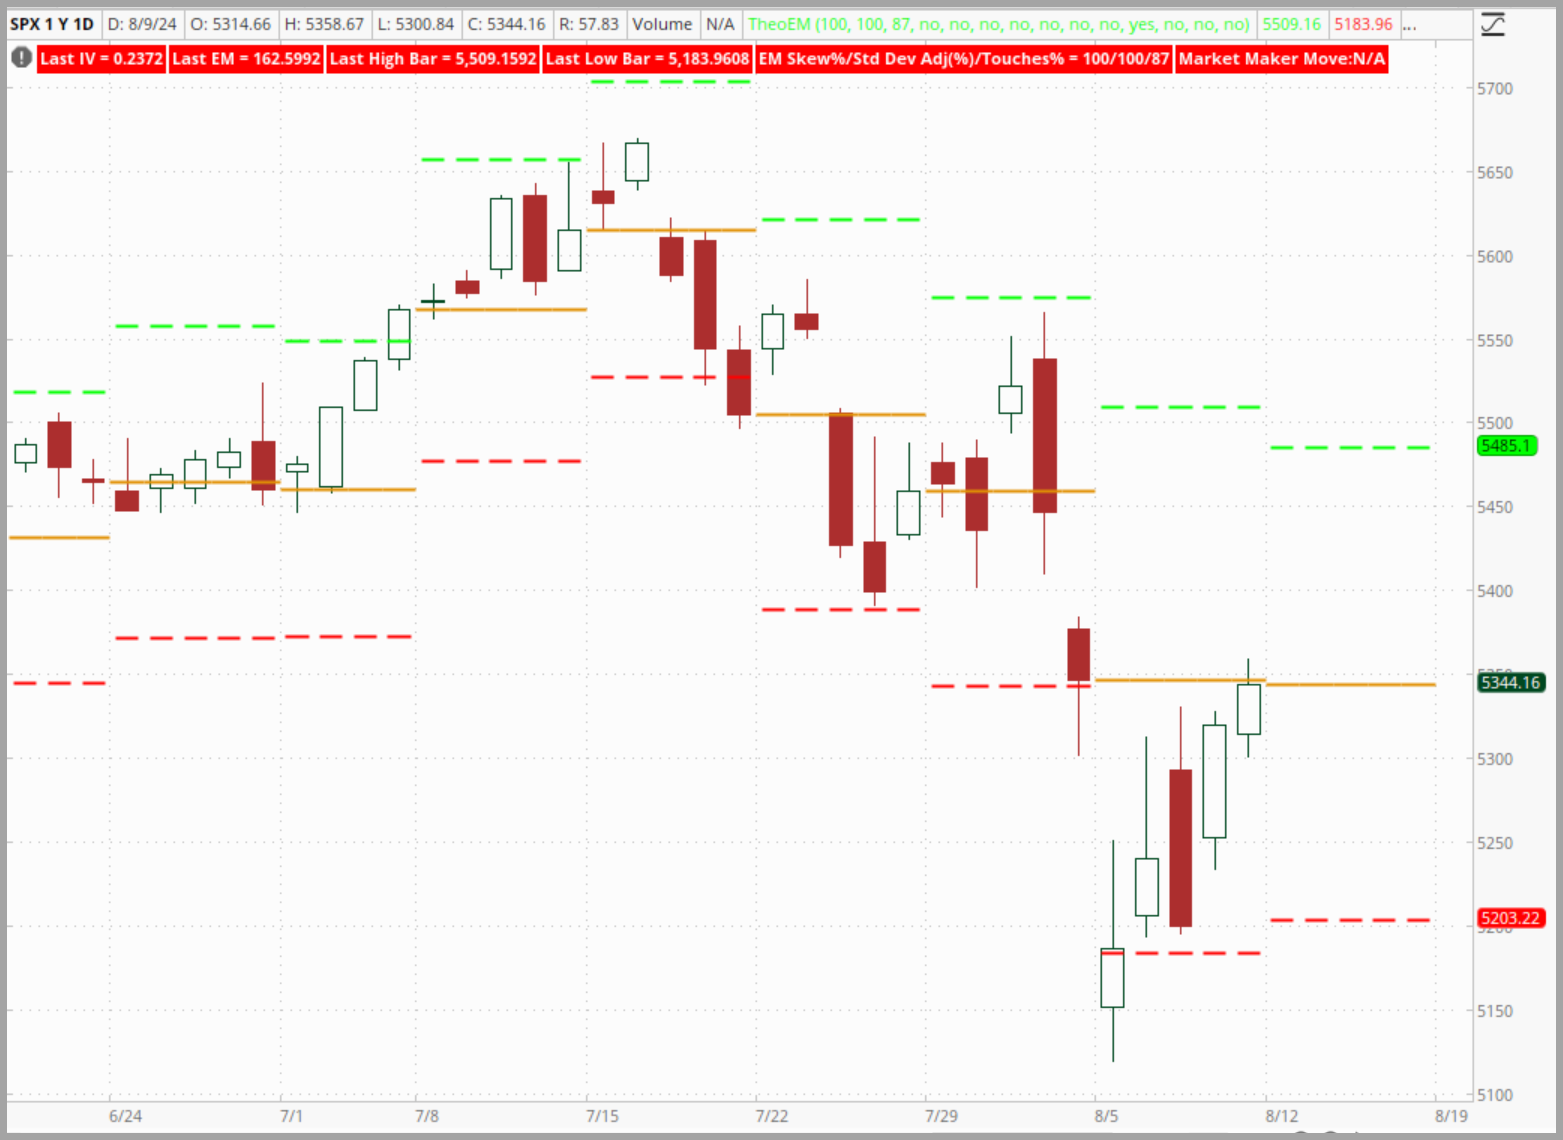
According to statistics derived from the options market, this week’s “Expected Move” (EM) for the S&P 500 is +/- 141 points, 21 points less than last week’s EM, but still large. The chart below highlights the potential range for each week based on Fridays implied volatility values using the green and red dashed lines. The yellow line is simply Fridays closing value for reference. Note in weeks past how the market tends to stay inside these ranges.
Key Events:
This week is packed with earnings, as 975 companies are scheduled to report. We also have a busy week for economic data, with the key reports being Tuesday’s Producer Price Index (PPI) on wholesale inflation and Wednesday’s Consumer Price Index (CPI) on retail inflation.
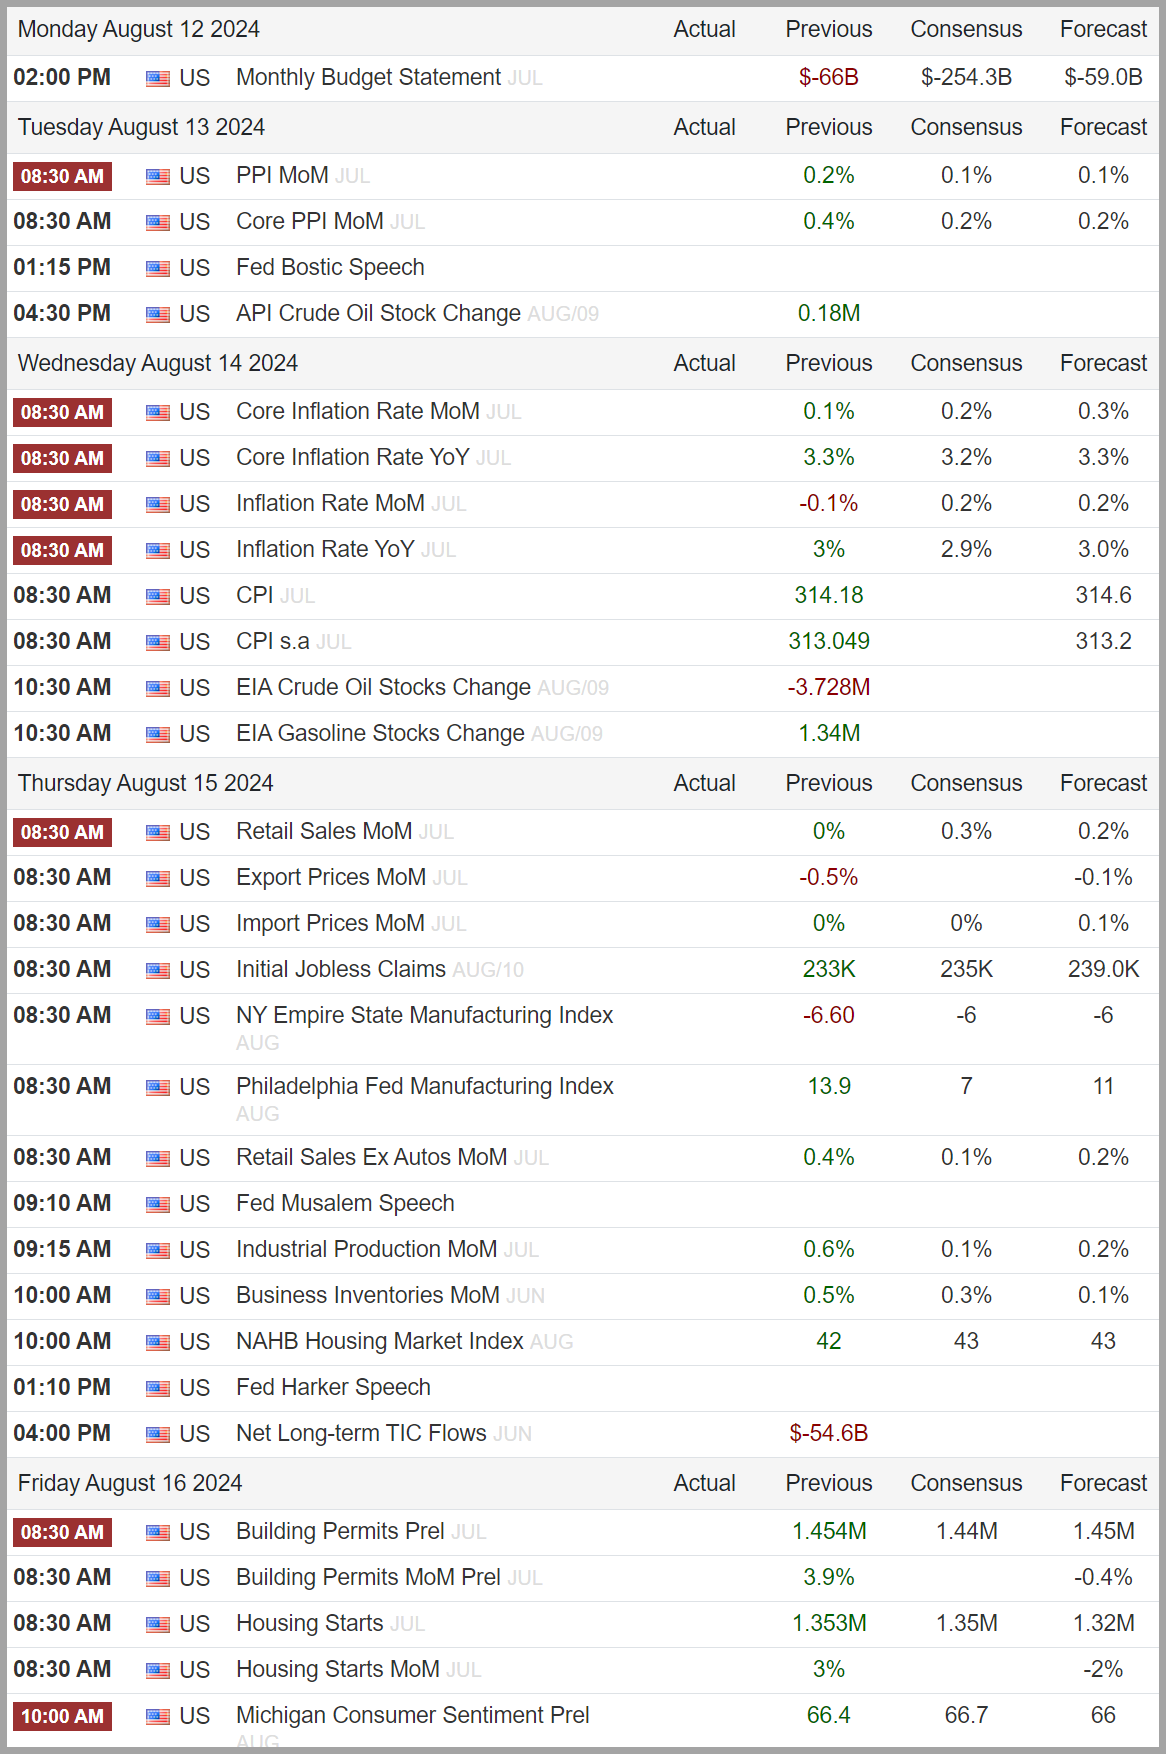
Source: Trading Economics (https://tradingeconomics.com/united-states/calendar#)
Tidbits & Technicals: (New developments will be denoted via***)
Current Headwinds:
- Valuations seem frothy given the current rate environment, leaving the markets subject to a potential swift pullback!
- “Higher for Longer” – Risk that the Federal Reserve waits too long to begin lowering rates and threatens economic growth.
- ***Very narrow market participation, apparently driven primarily by mega cap tech and AI-related companies, has dominated the indices; however, over the last couple of weeks we have witnessed a significant broadening effect with “the rest of the market” showing stronger returns.
Current Tailwinds:
- Optimism surrounding Artificial Intelligence (AI)
- The Federal Reserve potentially cutting rates in the future.
- Strong Labor Market
- Solid Economic Growth
- Continued Earnings Growth (the pace of which may be slowing)
- Momentum
- 10-year Treasury yields continue to hover near their lowest levels since March of this year.
Sentiment:
- ***Credit Spreads have recently raced higher by 25% as bond investors are requiring a significantly higher risk premium for holding the debt of less creditworthy companies.
- The VIX (CBOE Volatility Index) has lept higher suggesting fear among investors at the present time
- The CNN FEAR & Greed Index has moved to Extreme Fear
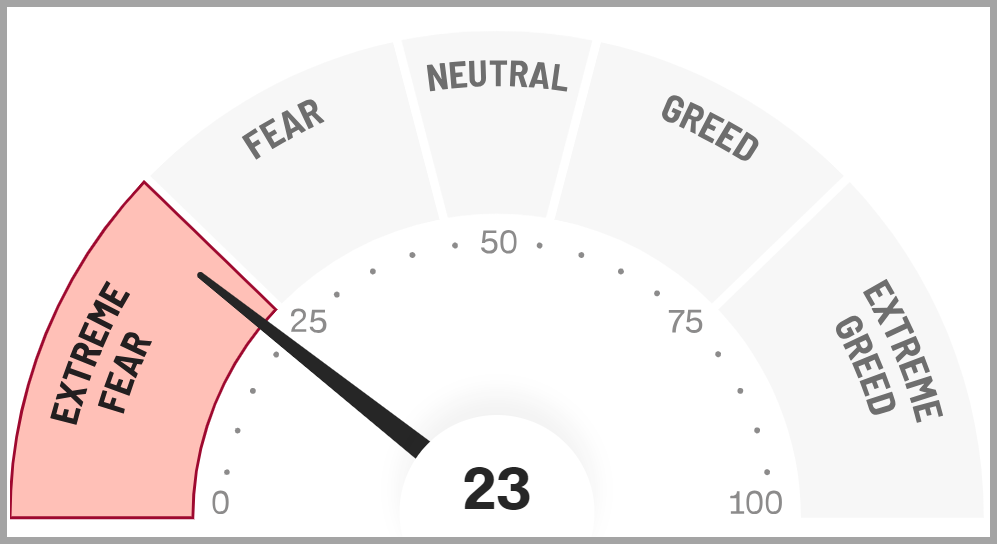
Source: https://www.cnn.com/markets/fear-and-greed
Intermarket Trends:
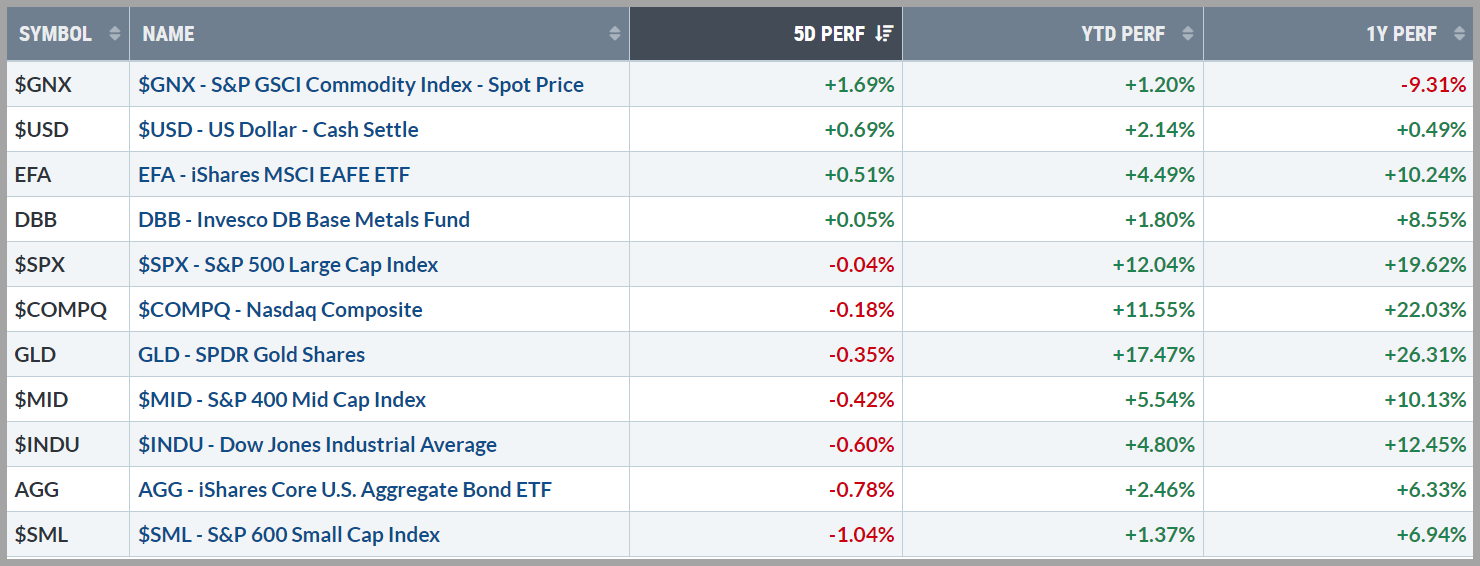
- ***The major Indices (Dow Jones Industrial Average, S&P 500, and NASDAQ) recently posted new highs signifying a positive long-term trend, however, in the short-term they are trending downward
- ***Interest rates have been volatile lately and are trending lower
- ***The US Dollar has broken its upward trend line over the past several weeks and is beginning to trend downward
- Gold recently broke out of its trading range to record high and appears to be consolidating at this time
- Industrial Metals, which raced higher recently, have retraced all recent gains and are back in the middle of the large consolidation zone of the past year
- Oil futures are in the middle of their one-year trading band and appear to be stuck in a trading range
Tying it all together:
In the long term, economic growth is the primary driver and, while growth remains robust, we are now seeing signs of moderation. This does not mean everything is falling apart, in fact, this was the Federal Reserve Board’s intention. They have held interest rates high for a long time to combat inflation and the expected result of such policies is economic moderation and a cooling of the labor market. The Fed is shooting for a soft landing, a scenario whereby inflation returns towards their 2% target without destroying economic growth, and so far that scenario appears most likely.
I’m keeping this paragraph below from my prior reports as it really sums up expectations and what is currently taking place:
“Four main factors have seemingly been supporting the markets — strong growth, falling inflation, expectations of Fed rate cuts, and AI enthusiasm. These drivers remain intact; however, some key economic data points, like rising unemployment, are flashing warning signals at the present time. While the economy is not weak, some of the data suggests a weakening trend and this is a concern given the equity markets are not acknowledging the possibility of any sort of economic contraction. Current valuations have certain equities priced for perfection, so it would be fair to say that any type of growth scare could result in rather extreme volatility in the short run.”
I will reiterate that the best approach in these environments is to ensure that one’s overall portfolio aligns with their risk tolerance and long-term goals and add to this the importance of keeping emotions at bay. Markets tend to overreact to both positive and negative data and keeping a calm perspective has always proven prudent.
Please feel free to share these commentaries with friends and family and, should you have any questions regarding your current strategy or the markets in general, please reach out to your CIAS Investment Adviser Representative.
Important Disclosures:
Past performance is not indicative of future results. This material is not financial advice or an offer to sell any product. The statements contained herein are solely based upon the opinions of Edward J. Sabo and the data available at the time of publication of this report, and there is no assurance that any predicted or implied results will actually occur. Information was obtained from third-party sources, which are believed to be reliable, but are not guaranteed as to their accuracy or completeness.
The actual characteristics with respect to any particular client account will vary based on a number of factors including but not limited to: (i) the size of the account; (ii) investment restrictions applicable to the account, if any; and (iii) market exigencies at the time of investment. Capital Investment Advisory Services, LLC (CIAS) reserves the right to modify its current investment strategies and techniques based on changing market dynamics or client needs. The information provided in this report should not be considered a recommendation to purchase or sell any particular security. There is no assurance that any securities discussed herein will remain in an account’s portfolio at the time you receive this report or that securities sold have not been repurchased. The securities discussed may not represent an account’s entire portfolio and in the aggregate may represent only a small percentage of an account’s portfolio holdings. It should not be assumed that any of the securities transactions, holdings or sectors discussed were or will prove to be profitable, or that the investment recommendations or decisions we make in the future will be profitable or will equal the investment performance of the securities discussed herein.
CIAS is a registered investment advisor. More information about the advisor, including its investment strategies and objectives, can be obtained by visiting www.capital-invest.com. A copy of CIAS’s disclosure statement (Part 2 of Form ADV) is available, without charge, upon request. Our Form ADV contains information regarding our Firm’s business practices and the backgrounds of our key personnel. Please contact us at (919) 831-2370 if you would like to receive this information.
Capital Investment Advisory Services, LLC
100 E. Six Forks Road, Ste. 200; Raleigh, North Carolina 27609
Securities offered through Capital Investment Group, Inc. & Capital Investment Brokerage, Inc.
100 East Six Forks Road; Raleigh, North Carolina 27609
Members FINRA and SIPC