
While last week’s solar eclipse caught the media’s attention, inflation data was Wall Street’s excitement.
Tim Whetro
Weekly Market Insights
While last week’s solar eclipse caught the media’s attention, inflation data was Wall Street’s excitement. On Wednesday, the annual core consumer price inflation (CPI) rate, which excludes volatile items such as food and energy, came in at a near three-year low of 3.8%, matching February’s reading and ever so slightly above the market forecasts of 3.7%, yet markets took this as an excuse to unload some excess froth. Thursday, producer prices (PPI) in the US were up only 0.2% month-over-month, the smallest increase in three months, and below forecasts of a 0.3% rise and equity markets largely gained back Wednesday’s losses. On Friday, US import data added a little fuel to recent inflation concerns as did JP Morgan Chase’s CEO, Jamie Dimon, when he warned about persistent inflations’ effect on the economy, but the trifecta occurred when reports that Israel was preparing for an imminent attack by Iran surfaced sending Oil prices higher (think inflation again) and adding another dose of geopolitical risk to a market that was already on edge.
Key Takeaway:
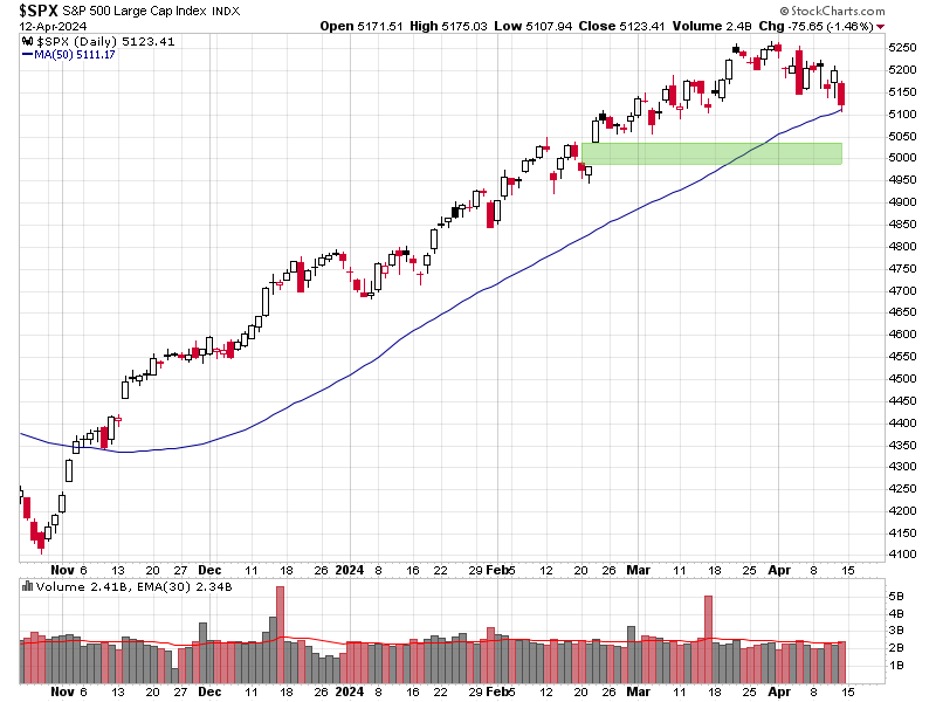
There was nothing too exciting about last week’s economic data in my opinion, yet bond investors continued to price in “High for Longer” interest rates (as can be seen in the CME FedWatch tool below) and stock investors took note. New tensions in the Middle East seemingly provided the perfect catalyst for traders to push the S&P 500 down to the 50-day moving average, a widely followed technical indicator (blue line on the chart above). None of this should come as a surprise to readers of these missives, as I’ve been telegraphing the idea over the past few weeks that I believed valuations have gotten a little ahead of themselves, markets appeared technically overbought given the recent advance, and we may be due for a pause or pullback when considering historical data.
The Week Ahead:
This week’s pivotal report is Monday’s Retail Sales release. Falling short of expectations for two consecutive months, this report reflects a cautious outlook among retailers, marked by disappointing earnings and a growing chorus of warnings about consumer spending. If retail sales disappoint again, signaling trouble for the consumer, brace for heightened volatility, potentially significant, as a slowdown in consumer spending raises the specter of a hard landing.
Additionally, we’ll gain insight into April’s economic activity with the release of the Empire Manufacturing and Philly Fed Indices and given last week’s concerns about inflation, the price indices could hold even greater significance than the headline figures, which are often quite volatile. We will round it out with some real estate and jobs data.
***8:30 AM Update- Retail Sales came in more than double expectations and futures are up significantly***
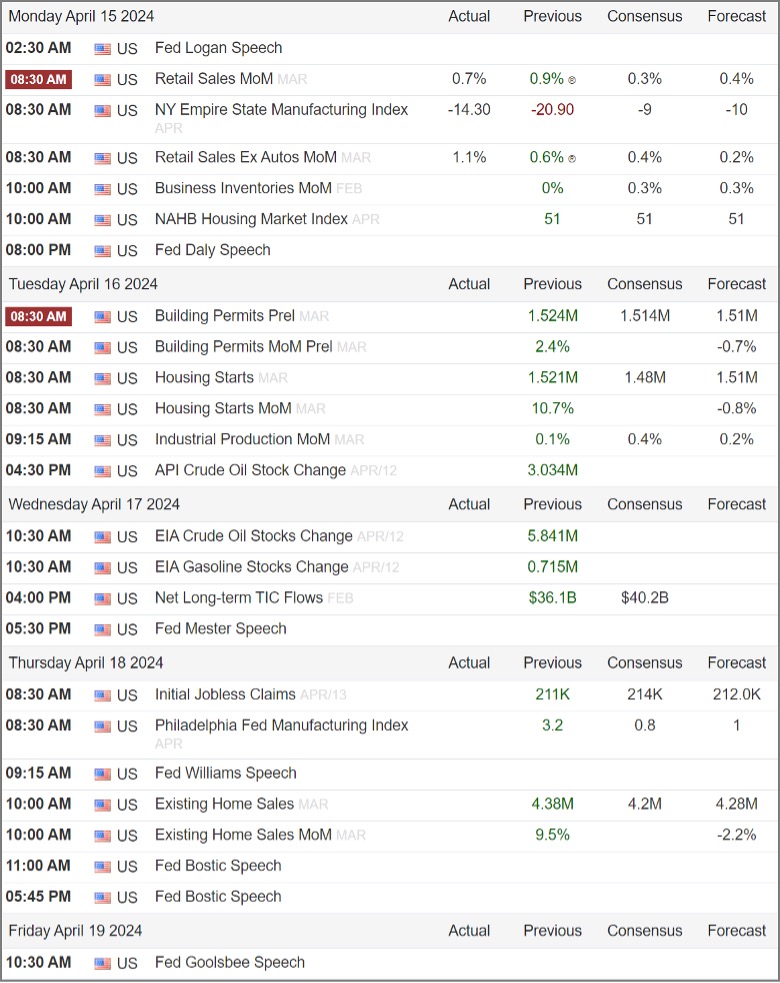
Source: Trading Economics (https://tradingeconomics.com/united-states/calendar#)
Tidbits & Technicals: (New developments will be denoted via***)
Current Headwinds:
- Valuations seem frothy given the current rate environment, leaving the markets subject to a potential swift pullback.
- “Higher for Longer” – Risk that the Federal Reserve waits too long to begin lowering rates and threatens economic growth.
- 10-year Treasury Yields broke out to new highs for the year signaling that bond investors may be beginning to believe in the “Higher for Longer” thesis.
Current Tailwinds:
- Optimism surrounding Artificial Intelligence (AI)
- Federal Reserve pivoting from raising rates to potentially cutting in the future.
- Strong Labor Market
- Solid Economic Growth
- Continued Earnings Growth (the pace of which may be slowing)
- Momentum
- Participation is Broadening with value, cyclicals, and smaller sized companies beginning to show a strong upward bias
Sentiment:
- Credit Spreads remain tight, signaling the bond market (aka “Smart Money”) is not worried about a recession in the near future.
- The VIX (CBOE Volatility Index) has broken through this years “complacency zone”.
- ***The CNN FEAR & Greed Index dropped into Neutral territory last week, signifying investors’ enthusiasm has dried up a bit.
***I’ve added the red arrows to the CME FedWatch Tool graphic below to illustrate the significant drop in expectations for a June rate cut this year.
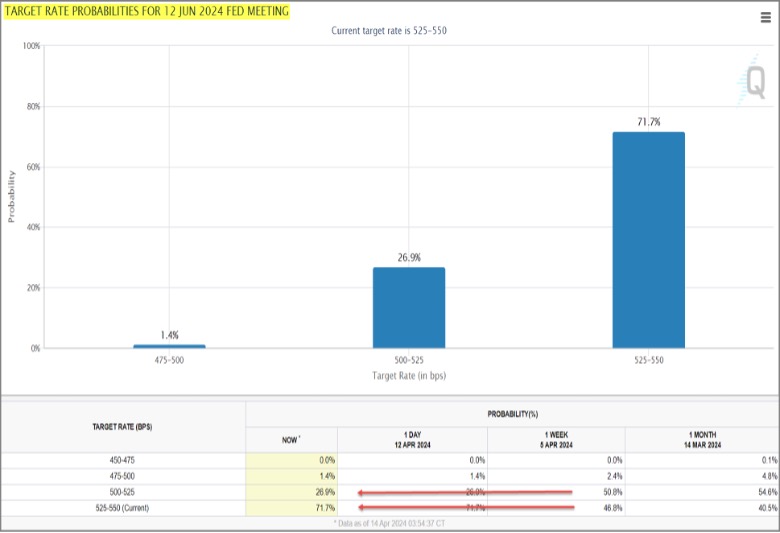
Source- CME Group (https://www.cmegroup.com/markets/interest-rates/cme-fedwatch-tool.html)
Intermarket Trends:
- The major Indices (Dow Joines Industrial Average, S&P 500, and NASDAQ) all posted new highs in the past few weeks signifying a positive trend.
- ***Bond investors have been pricing in the idea of higher for longer recently with 10-year treasury yields above this year’s trading range to make new highs.
- The US Dollar is trading near the upper end of this year’s trading range due to foreign central banks being the first to cut rates and others taking further rate hikes off the table while the Fed continues its campaign of tough rhetoric.
- Gold continues to set record highs.
- Industrial Metals caught a bid recently and copper recently broke out of a multi-month trading range.
- Oil is trading near the top of its 2024 range but well below last year’s highs.
Tying it all together:
The recent uptick in market volatility, marking the first significant fluctuation since the rally began in October ‘23, isn’t unexpected given the high equity valuations and recent investor complacency. Concerns about the prospect of prolonged high interest rates are emerging among bond investors, evident in the surge of longer-term interest rates to new yearly highs.
“Sticky Inflation” is the current topic du jour, however, nobody ever said the battle against it was going to be easy and the rather robust economy continues to chug along. It wasn’t long ago when everyone was screaming recession, but we are not hearing that word every day now, I believe this too shall pass. The next focus will likely turn to the upcoming elections, and it will be interesting to see how all this interest rate talk plays out in the political arena.
From a technical perspective, the current short-term set-up looks pretty good. The textbooks generally agree that after a strong advance, markets take a breather and retreat to some significant technical level and the primary trend resumes. With equity markets recently making a series of all-time highs, the primary trend is undoubtedly up so don’t take this recent bout of volatility too strongly. Markets pull back quite often, and this is all perfectly normal in a bull market. The 50-day moving average is the first “level” I see on the charts, and it did appear to provide some stopping power on an intraday basis on Friday. Time will tell if that’s all we need to shake off some of the excess or if buyers’ interest resides at some lower point in the auction process. (For those interested, — the next level of potential support I see is the green shaded gap on the first chart with the round number of 5000 sitting square in the middle.)
Please feel free to share these commentaries with friends and family and, should you have any questions regarding your current strategy or the markets in general, please reach out to your CIAS Investment Adviser Representative.
Important Disclosures:
Past performance is not indicative of future results. This material is not financial advice or an offer to sell any product. The statements contained herein are solely based upon the opinions of Edward J. Sabo and the data available at the time of publication of this report, and there is no assurance that any predicted or implied results will actually occur. Information was obtained from third-party sources, which are believed to be reliable, but are not guaranteed as to their accuracy or completeness.
The actual characteristics with respect to any particular client account will vary based on a number of factors including but not limited to: (i) the size of the account; (ii) investment restrictions applicable to the account, if any; and (iii) market exigencies at the time of investment. Capital Investment Advisory Services, LLC (CIAS) reserves the right to modify its current investment strategies and techniques based on changing market dynamics or client needs. The information provided in this report should not be considered a recommendation to purchase or sell any particular security. There is no assurance that any securities discussed herein will remain in an account’s portfolio at the time you receive this report or that securities sold have not been repurchased. The securities discussed may not represent an account’s entire portfolio and in the aggregate may represent only a small percentage of an account’s portfolio holdings. It should not be assumed that any of the securities transactions, holdings or sectors discussed were or will prove to be profitable, or that the investment recommendations or decisions we make in the future will be profitable or will equal the investment performance of the securities discussed herein.
CIAS is a registered investment advisor. More information about the advisor, including its investment strategies and objectives, can be obtained by visiting www.capital-invest.com. A copy of CIAS’s disclosure statement (Part 2 of Form ADV) is available, without charge, upon request. Our Form ADV contains information regarding our Firm’s business practices and the backgrounds of our key personnel. Please contact us at (919) 831-2370 if you would like to receive this information.
Capital Investment Advisory Services, LLC
100 E. Six Forks Road, Ste. 200; Raleigh, North Carolina 27609
Securities offered through Capital Investment Group, Inc. & Capital Investment Brokerage, Inc.
100 East Six Forks Road; Raleigh, North Carolina 27609
Members FINRA and SIPC